Data Processing Pipeline
A sophisticated multi-stage system for vacancy prediction and visualization
From data collection to visualization: our comprehensive pipeline, interactive tools, and quality assurance framework
A sophisticated multi-stage system for vacancy prediction and visualization
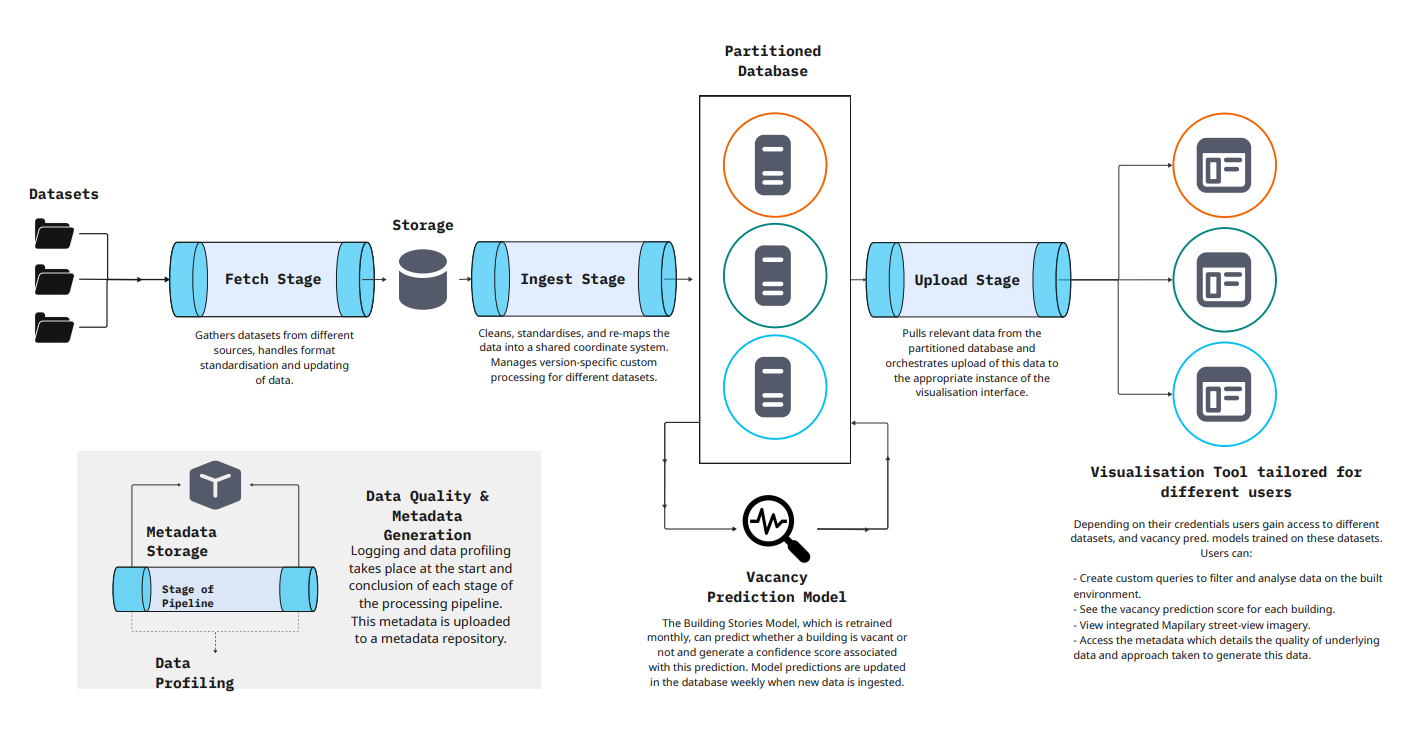
Gathers datasets from local authorities, GeoDirectory, and various geospatial repositories, handling format standardisation and updating of data.
Cleans, joins, and standardises data into a shared coordinate system. Supports multiple aggregation functions and manages version-specific custom processing for different datasets.
PostgreSQL-based centralized storage with PostGIS extension, optimized for geospatial queries and machine learning operations.
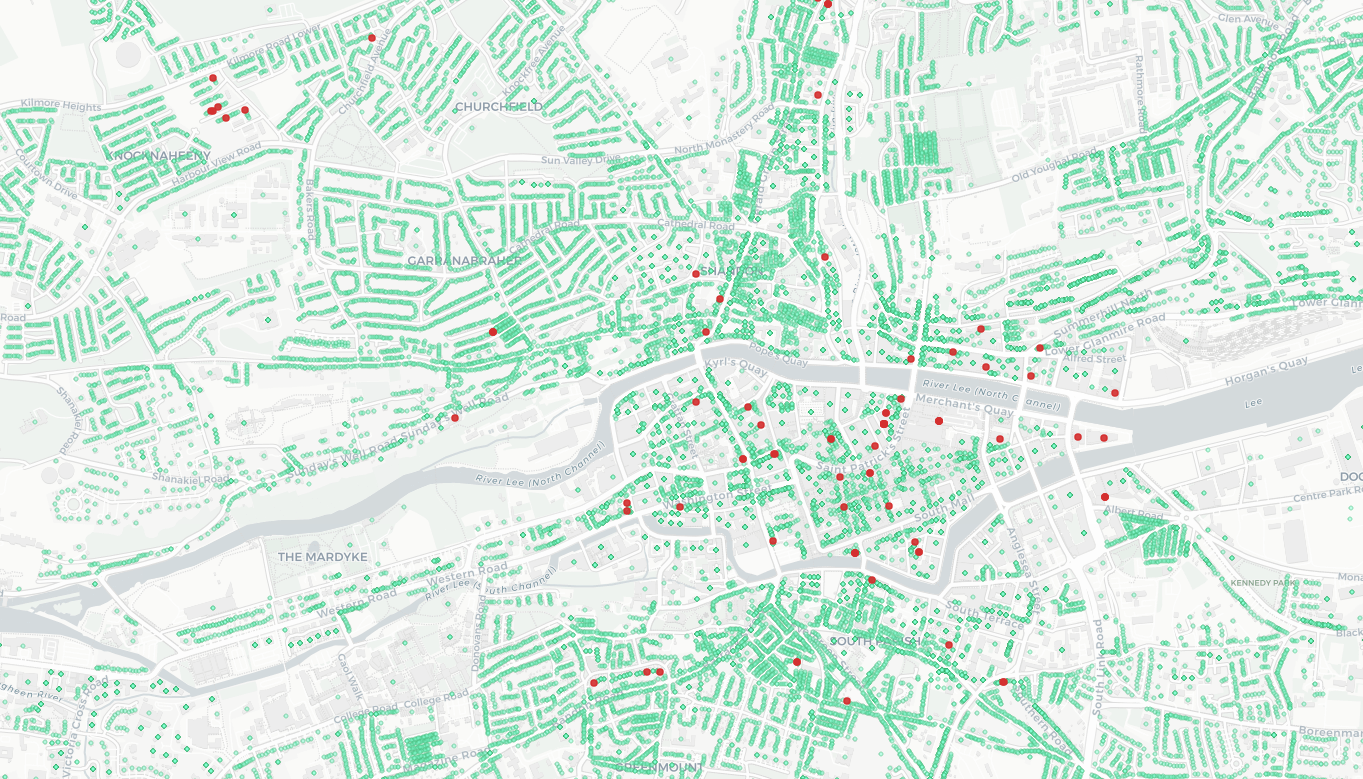
The Building Stories Model, which is retrained monthly, can predict whether a building is vacant or not and generate a confidence score associated with this prediction. Model predictions are updated in the database weekly when new data is ingested.
Pulls relevant data from the partitioned database and orchestrates upload of this data to the visualization interface for end-user access.
Interactive platform for exploring and analyzing building vacancy data
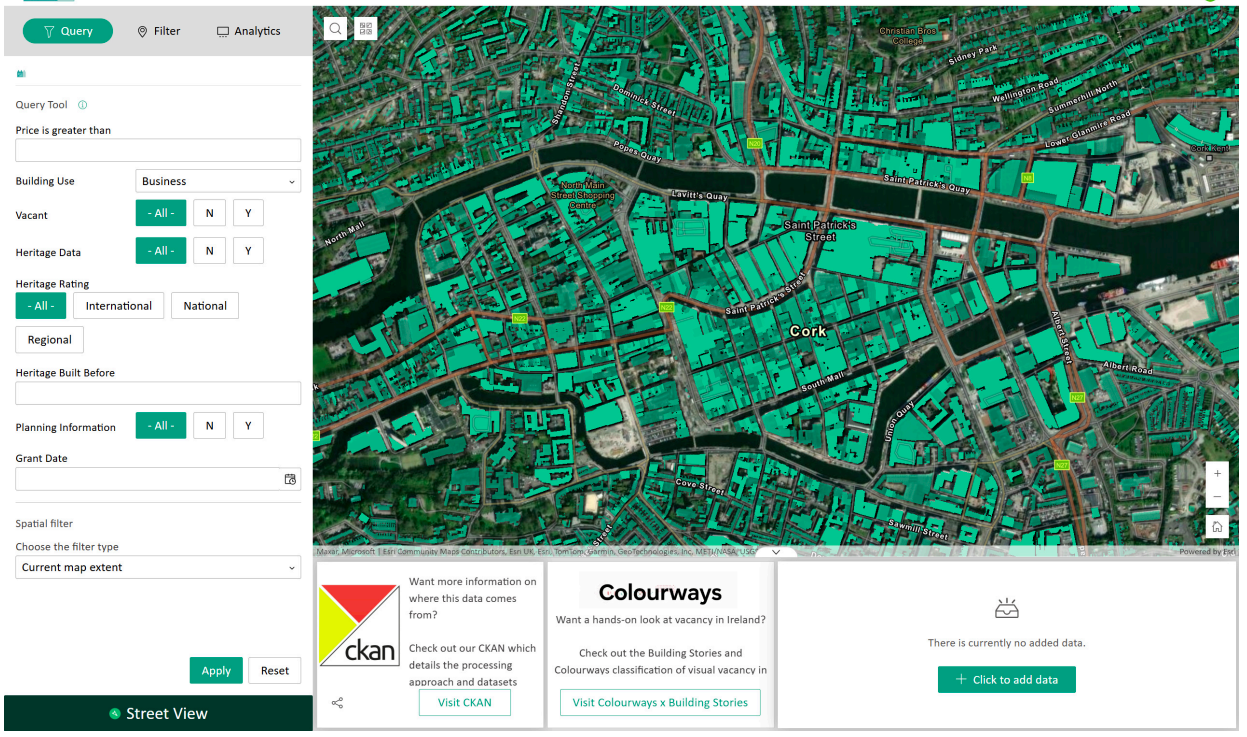
Built using ArcGIS Experience Builder Developer Edition with ReactJS, the platform provides role-based access where users gain access to different datasets and vacancy prediction models trained on these datasets based on their credentials.
Comprehensive data governance and quality assurance throughout the pipeline
Logging and data profiling takes place at the start and conclusion of each stage of the processing pipeline. Quality checks, reports, and records are stored in RDF (Resource Description Framework), a standard machine-readable format, and uploaded to a metadata repository.
Continuous validation of data integrity, completeness, and consistency throughout the pipeline
Quality checks, reports, and records stored in RDF format for standardized, machine-readable documentation
Complete lineage tracking of data versions and processing stages
CKAN and Knowledge Graphs for transparent data management and accessibility